Advance App Analytics
Tracking your mobile app’s analytics should not be a troublesome task. MageNative’s app analytics feature enables easy performance tracking and provides valuable insights into how well your app is performing and what your users engage with the most. Our user-friendly analytics dashboard gives you access to all key metrics, helping you make informed decisions to improve your app’s performance.
How to Access MageNative’s Analytics Dashboard?
- Log in to your MageNative Admin Panel using your credentials.
- Click on Analytics from the left sidebar menu. MageNative’s Analytics dashboard will open up.

- You’ll be redirected to MageNative’s Analytics Dashboard. It provides a comprehensive overview of the performance of your app and user engagement metrics.
What are the Key Metrics in the Analytics Dashboard?
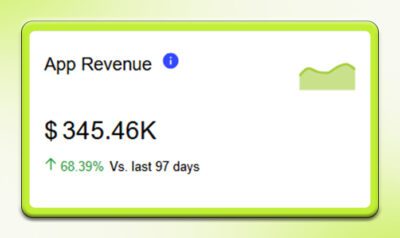
App Revenue
Mobile app revenue refers to the total income generated by your app over a specific period. This metric helps you understand your app’s financial performance and adjust your sales strategies accordingly.
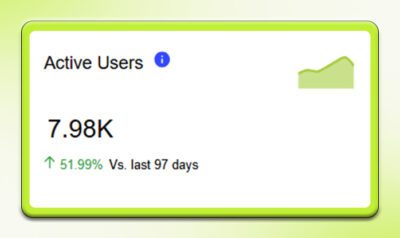
Active Users
This metric shows the number of users who regularly engage with your app. It is a key indicator of user engagement and app popularity. Understanding your active user base helps you tailor your app’s features and content to meet user preferences.
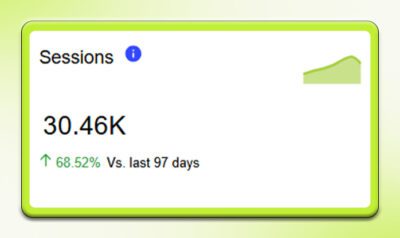
Sessions
A session starts when a user opens your app and ends when they close it. Monitoring sessions helps you gauge user engagement and app usage. It also provides insights into user behavior and preferences, helping guide your marketing efforts.
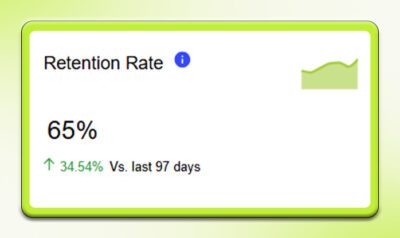
Retention Rate
Retention rate represents the percentage of users who continue using your app over a specified period. A high retention rate indicates that users find value in your app and are satisfied with the experience.
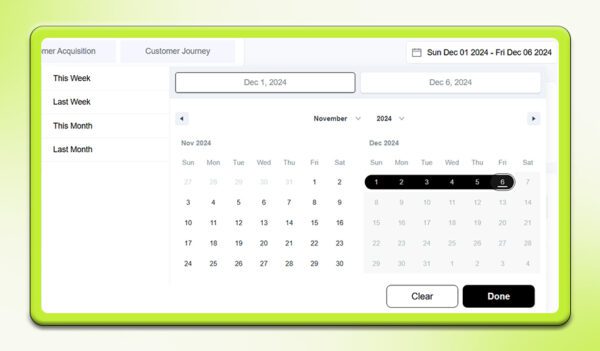
Choose Range
The Choose Range option allows you to view app analytics for a specific time frame, such as today, yesterday, last week, or last month. This helps you analyze trends and performance across different periods.
Mobile Application Revenue
Mobile App Revenue is one of the most important metrics and consists of two key components—Sales and Orders. It displays total sales and the total number of orders placed through your mobile app during a selected period. This metric helps evaluate app earnings and supports smarter decision-making.

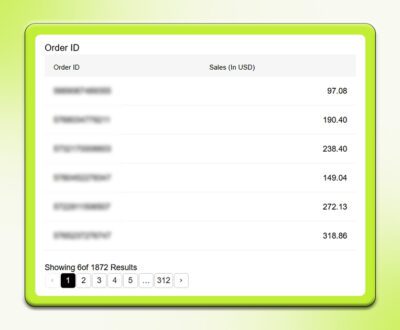
Order Id
Each order is assigned a unique identification number called an Order ID, which helps you locate, organize, and track orders efficiently.
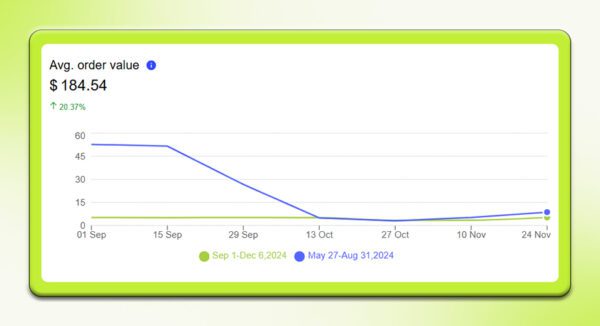
Avg. Order Value
This metric indicates the average amount spent per order. It is calculated by dividing total sales by the number of orders. Average Order Value helps you plan promotions, discounts, and product bundles based on customer purchasing behavior.
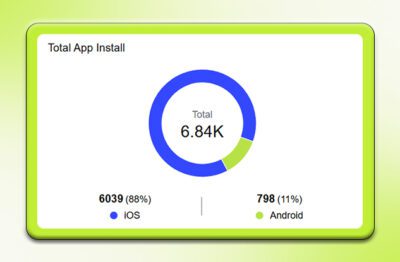
Total App Installs
This metric shows how many times your mobile app has been installed. Tracking installs over time helps merchants evaluate user base growth and assess the effectiveness of marketing and promotional campaigns.
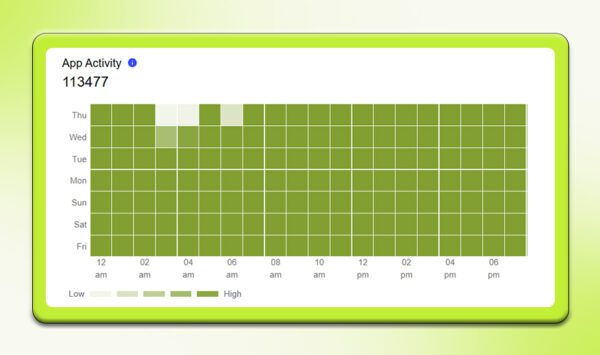
App Activity
This key metric uses a heatmap to show total sessions by day and hour. This heatmap employs varying shades to convey information: darker colors indicate hours with a high number of sessions (high app activity), while lighter colors represent hours with fewer sessions (low app activity).
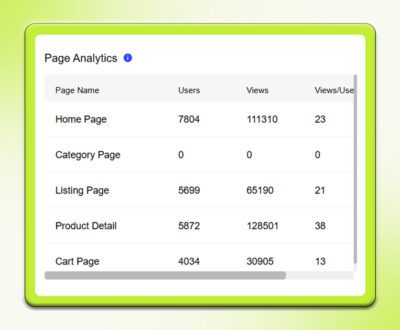
Page Analytics
Page Analytics provides insights into how users interact with different app pages, such as the home page, category pages, and product pages. This data helps identify popular sections and areas that need improvement.
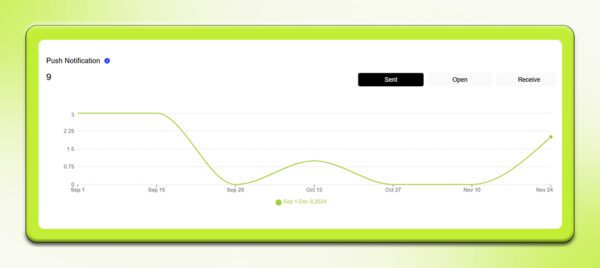
Push notifications
This metric tracks push notification performance, including how many notifications were sent, received, and opened. It helps evaluate the effectiveness of your push notification strategy.
How can I use analytics data to plan effective marketing strategies?
Analytics data provides insights that can help you design better marketing strategies. By interpreting how users interact with your app, you can make more informed & data driven decisions. Here are some use cases how you can interpret the analytics data you get from MageNative’s Analytics Dashboard:
Scenario 1: If you see many active users, it indicates your app is resonating well with your audience. It means your marketing strategy in terms of engagement methods such as promotions or updated contents are going good. Therefore, you can keep continuing the strategies in future campaigns
Scenario 2: If certain user groups engage more with some features, it is a golden opportunity to tailor your marketing efforts. For example, if the younger user group comes to a specific feature, you can create targeted marketing campaigns centered around that feature. It can significantly increase engagements and conversion rates.
Scenario 3: Low retention rates indicate that users are not getting enough value from your app. This can be due to bad user experience or insufficient personalization. To tackle this, you can work on enhancing your app’s usability or introduce personalized features. It helps improve user satisfaction and urges them to keep coming back.
Scenario 4: If your push notifications have high open rates but low engagement. This can suggest that users receive your notifications but probably are not convinced by their content to take some further actions. You can improve this by analyzing messaging timing and frequency from your end. You can even experiment with fresh, new & creative content for push notifications.
Here are some more recommended blogs to understand App Analytics in a better way:
- Data-Driven Decision Making: The Power of Mobile App Analytics
- Unlocking Success: Leverage Data Driven Analytics In Mobile Apps For Informed Decision-Making
FAQ’s:
Why are analytics needed in a mobile app?
Analytics is required to track the performance of mobile app which includes user engagement, traffic, and retention. All these metrics help in finding out the areas for improvement and enhances the app’s effectiveness.
Why is it necessary to track the performance of the app?
Tracking performance of your mobile app is critical to a business’s growth. It lets the merchant know whether the app is actually attracting new users and driving conversions. This in turns helps merchants make the right call with data-driven decisions to optimize their business strategy.
What elements do MageNative’s app analytics have?
MageNative’s app analytics include elements like traffic, session, active users, installs, average order value, revenue, and much more to ensure seamless performance tracking.
Feel free to reach out to our support team if you have questions or need support. We are here to help and address any issues you may have!


